
A swimlane process map is a cross-functional flowchart that shows who does what, at every step, across every team involved in a process. It arranges activities into horizontal or vertical lanes, each one representing a role, team, or system, so handoffs and bottlenecks become visible instead of buried in tribal knowledge.
The main benefit is accountability. When a claim sits unresolved for three weeks, a swimlane diagram shows exactly where it stalled and whose lane it stalled in.
- Lanes represent roles, teams, or systems, not individuals
- Formats run horizontal (top to bottom) or vertical (left to right), whichever suits the process
- Core value is exposing handoffs, the points where errors and delays cluster
Key Takeaways
Swimlane process mapping works because it makes handoffs, not tasks, the visible unit of analysis, exposing exactly where delays and accountability gaps form between teams.
| Point | Details |
|---|---|
| Handoffs are the target | Most process failures occur at the boundary between lanes, not within a single team's tasks. |
| Label lanes by role | Role-based labels keep diagrams accurate after staff or organisational changes. |
| Timebox the workshop | Run mapping sessions for 60 to 90 minutes for a medium-complexity process. |
| Annotate every handoff | Record the payload, format, and timeframe on each arrow crossing a lane. |
| Keystoneconsulting integrates mapping into governance | Videra turns mapped handoffs into stage-gated, audit-ready reporting for regulated sectors. |
Table of Contents
- What a swimlane process map contains and why it matters
- Key components and notation
- How to run a mapping workshop and draft a working swimlane diagram
- Best practices and common mistakes to avoid
- Examples and templates worth adapting
- Swimlane diagram vs flowchart vs service blueprint vs BPMN
- How Keystoneconsulting applies swimlane mapping in practice
- Editorial take: why the workshop matters more than the software
- Get swimlane mapping built into your governance, not left on a whiteboard
- Frequently asked questions
- Sources
What a swimlane process map contains and why it matters
A working swimlane diagram has five building blocks: lanes, activities, decisions, handoffs, and clear start/end markers. Lanes are the containers; activities are the boxes inside them; decisions are the branch points where a process forks based on a condition; handoffs are the arrows that cross from one lane into another, and they matter more than anything else on the page.
Most process failures don't happen inside a single team's lane. They happen in the gap between lanes, where a form gets stuck in an inbox or nobody quite owns the follow-up. That's why the Rummler & Brache framing treats handoffs as the primary target for improvement, not the individual tasks themselves.
Take a claims-handling process: intake, underwriting review, approval, and payout might each sit in a different lane. Draw it out and you'll often find the delay isn't in underwriting, it's in the 48 hours nobody checks the shared inbox between intake and review.
- Onboarding: HR, IT, and line manager lanes reveal who actually issues laptop access
- Procurement: requester, approver, and finance lanes expose where invoices stall
- Claims handling: intake, assessment, and payout lanes surface the review bottleneck
Mural's research found that 66% of knowledge workers aren't happy with how their team collaborates, a signal that most workplace friction sits precisely at these cross-team boundaries.
Key components and notation
You don't need formal BPMN training to draw a usable swimlane diagram, but a handful of conventions keep it readable months after you've drawn it.
Stick to three shapes: a rounded rectangle for activities, a diamond for decisions, and a rounded oval for start/end points. Anything more elaborate slows people down without adding clarity.
- Label lanes by role, not by name ("Claims Handler," not "Sarah")
- Use system lanes when software, not a person, performs the step (an automated approval engine, for instance)
- Group related lanes into a pool when they belong to the same department or organisation
- Show parallel work with two lanes running side by side rather than forcing a false sequence
- Note timing or SLAs directly on the arrow between lanes, not buried in a separate document
For decisions, write the actual criterion on the diamond ("Amount over $5,000?"), not a vague label like "Check." Ambiguous decision points are one of the most common reasons diagrams get abandoned after the first workshop, because nobody can agree what the diamond meant six months later.
Pro Tip: Colour-code lanes by department once, save it as a template, and every future diagram in your organisation reads consistently at a glance.
How to run a mapping workshop and draft a working swimlane diagram
A swimlane diagram is only as good as the workshop that produced it. Rushing this step is the single biggest reason diagrams end up ignored.
- Scope the process first. Agree the trigger event and end point before anyone touches a whiteboard. "Order to cash" is too broad; "order confirmation to invoice sent" is workable.
- Collect lanes and roles beforehand. Send a short survey to participants asking who touches the process and in what system. Walking into a workshop without this wastes the first thirty minutes.
- Timebox the session. Practical guidance from Asamby Consulting suggests 60 to 90 minutes for a medium-complexity process, which is enough to map the steps without fatigue setting in.
- Map the steps in sequence, placing each activity in its owner's lane as the group talks through the process out loud.
- Mark every decision and handoff explicitly. Stop the group and ask "what exactly gets handed over here, and in what format?" every time an arrow crosses a lane.
- Draft the digital version within 48 hours, while the workshop discussion is fresh, using a tool like Miro's swimlane template to formalise scope, actors, steps, decisions, and timings.
- Annotate handoffs with what, format, and SLA. "Signed PO, PDF, within 24 hours" is useful. "Sends form" is not.
- Validate with stakeholders who weren't in the room, particularly anyone downstream who receives the outputs.
- Publish alongside your SOPs, not as a standalone file nobody finds again.
Split a lane into its own subprocess diagram once it accumulates more than six or seven internal steps, or once a single lane's detail starts crowding out the bigger picture. A procurement approval lane that itself involves three sign-off tiers deserves its own diagram, linked from the main one rather than crammed into it.
Pro Tip: Treat the diagram as a living artefact. Assign one owner to review it every quarter, otherwise it fossilises the moment the org chart changes.

Best practices and common mistakes to avoid
The gap between a diagram that gets used and one that gets forgotten usually comes down to a handful of disciplined habits.
- Label lanes by role, never by name. A lane called "Regional Manager" survives a reorganisation; a lane called "Dave" does not.
- Limit lanes to seven or eight at most. Beyond that, split into a pool of sub-diagrams rather than cramming everything onto one page.
- Label every handoff with payload, format, and timeframe. "Approval sent" tells nobody anything useful; "Signed approval form, email, within four hours" does.
- Make decision criteria explicit on the diamond itself. Vague diamonds are where diagrams lose credibility.
- Version and date every diagram, and store it next to the SOPs and templates it supports, not in a separate folder only the original author can find.
The most avoidable mistake is treating the diagram as a one-off deliverable rather than a document that gets reviewed. A diagram drawn once during a project kickoff and never touched again is worse than no diagram at all, because people keep referring to information that's quietly gone stale.
Pro Tip: If a lane has more decision diamonds than activity boxes, that's usually a sign the process needs simplifying before it needs mapping.
Examples and templates worth adapting
A customer support ticket flow works well as a four-lane example: Customer, Support Agent, Technical Team, and Billing System. The handoff worth labelling explicitly is the one from Support Agent to Technical Team, typically "escalated ticket with reproduction steps, via ticketing system, within two hours."
A purchase-to-pay process usually reveals its delays at the approval handoffs: Requester to Manager, Manager to Finance, Finance to Vendor. Most of the friction sits in the Manager to Finance step, where approvals queue up unseen.
Choosing the right format depends on your audience and how long the map needs to last.
| Format | Best for | Limitation |
|---|---|---|
| Whiteboard sketch | Fast, one-off workshops | Not shareable or durable |
| BPMN-lite | Technical or automation teams | Steeper learning curve for non-specialists |
| Digital collaborative template | Ongoing, team-maintained processes | Requires everyone to adopt the same tool |
For a first pass, a high-level diagram with five to eight steps is usually enough. Move to a detailed subprocess map only once you're trying to solve a specific bottleneck, such as a construction RFI process where every day of delay carries a real cost.
Swimlane diagram vs flowchart vs service blueprint vs BPMN
Reach for a swimlane diagram whenever the question is "who owns this step, and where does it hand off to someone else?" That's the scenario Atlassian's Team Central points to as the diagram's core use case.
- Traditional flowchart: use for a single-actor sequence with no cross-team handoffs to track
- Service blueprint: use when you need to show customer-facing (frontstage) actions alongside internal (backstage) support
- BPMN: use when the process needs to be translated into an executable, automated workflow, since BPMN 2.0's pools and lanes are built for that handoff to software
- Swimlane diagram: use whenever accountability and handoffs, not automation or customer experience, are the point
A procurement approval chain is a swimlane problem. A single warehouse picking sequence is a flowchart problem. Automating an invoice approval into your ERP is a BPMN problem.
How Keystoneconsulting applies swimlane mapping in practice
Keystoneconsulting has spent 20 years working inside healthcare, construction, and facilities management organisations where governance failures and reporting bottlenecks are the norm, not the exception. Mapped swimlane workflows sit at the centre of that work, not as a documentation exercise but as the input that feeds Videra, the platform Keystoneconsulting built to turn those maps into audit-ready reporting.
- Every mapped handoff becomes a trackable checkpoint inside Videra's stage-gated governance model
- AI-powered reporting draws directly on the lanes and handoffs defined during the mapping workshop
- Exception reports flag stalled handoffs automatically, rather than waiting for a monthly board review to catch them
Editorial take: why the workshop matters more than the software
Most advice on this topic focuses on notation: which shape means what, which tool to use, how to make the diagram look polished. That's the wrong emphasis. The diagram itself is the easy part. The workshop that produces it is where the value actually gets created or lost.
Conventional guidance tends to treat mapping as a solo exercise, one process owner sketching boxes at their desk. That produces a diagram that reflects one person's understanding of a cross-functional process, which is exactly the blind spot swimlane mapping is supposed to fix. The whole point is capturing what the handoff actually looks like from both sides, and you only get that by putting the people on either side of it in the same room.
If there's one thing worth prioritising above notation, tool choice, or even the diagram's final polish, it's forcing every handoff to be named explicitly during the workshop itself: what gets passed, in what format, within what timeframe. Diagrams that skip this step look complete and function as decoration. The ones that insist on it become the document teams actually argue over, which is precisely when you know it's working.
Get swimlane mapping built into your governance, not left on a whiteboard
Keystoneconsulting is the practical route for organisations that need swimlane process mapping to hold up under audit, not just look tidy in a workshop deck. Rather than handing you a template and leaving the follow-through to chance, Keystoneconsulting integrates directly with your teams to run the mapping workshops, draft the diagrams, and connect them straight into Videra's stage-gated governance and AI-powered reporting.
That matters most for healthcare, construction, and facilities teams where a missed handoff isn't just inefficient, it's a compliance exposure. If your organisation is wrestling with reporting bottlenecks or unclear accountability across departments, visit Keystoneconsulting to discuss how mapped workflows and Videra can turn your next process review into an audit-ready asset rather than another shelved diagram.
Frequently asked questions
What is the difference between a swimlane diagram and a normal flowchart? A flowchart maps a sequence of steps for a single actor or system. A swimlane diagram adds lanes that show which role, team, or system owns each step, making it the better choice whenever more than one party is involved.
How many lanes should a swimlane diagram have? Keep it to seven or eight lanes at most. Beyond that, split the process into a pool of linked subprocess diagrams rather than cramming everything onto one page.
Can swimlane diagrams be used for automation? They can inform automation planning, but BPMN is the formal notation used once a process is translated into executable, automated workflow steps.
How often should a swimlane diagram be updated? Review it at least quarterly, and immediately after any change to roles, systems, or handoff points, since a diagram that goes stale becomes actively misleading rather than simply outdated.
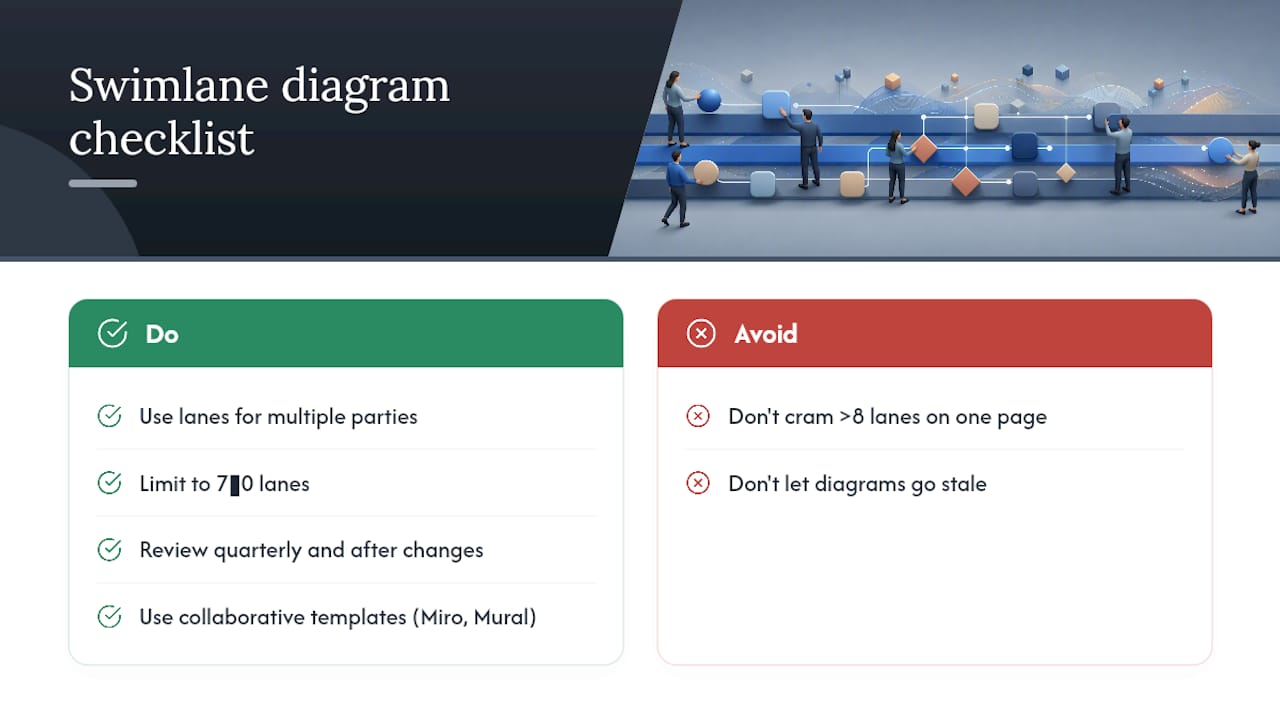
What tools are best for creating swimlane process maps? Whiteboard sketches work for a fast first pass; BPMN-lite suits technical teams; collaborative digital templates in tools like Miro or Mural work best for diagrams that a whole team needs to maintain over time.
Sources
- FREE Swimlane Flowchart Template | Cross-Functional Process Mapping | Miro 2026
- Free swimlane diagram template | Mural
- Swimlane Diagram: Definition, Step-by-Step Guide & Practical Example | SI Labs