
Business process mapping is defined as the visual documentation of workflows to clarify how work gets done, who does it, and where problems occur. Used across healthcare, construction, manufacturing, and professional services, it gives decision-makers a shared picture of operations that written procedures rarely achieve. The BBA Institute provides templates adopted worldwide to save time and improve communication during projects. Frameworks such as BPMN (Business Process Model and Notation), SIPOC diagrams, and swimlane maps each serve distinct purposes. The right business process mapping examples show you not just what a finished map looks like, but which format fits your situation.
1. What are the most common business process mapping examples?
Process mapping covers several distinct diagram types. Each suits a different level of complexity and a different audience.
Flowcharts are the simplest format. They use rectangles for tasks and diamonds for decisions, arranged in a sequential flow. Flowcharts work best for introductory and simple workflows where the audience has little technical background. A purchase approval process or a staff onboarding checklist maps cleanly as a flowchart.

Swimlane diagrams add a layer of accountability. Swimlanes assign lanes to individuals or teams, showing work progression horizontally and roles vertically. A customer complaint process that moves between a front-line agent, a supervisor, and a finance team is a classic swimlane use case. The diagram makes handoffs visible and removes ambiguity about who owns each step.
SIPOC diagrams operate at a higher level. SIPOC links suppliers, inputs, processes, outputs, and customers in a cause-and-effect flow. They are most useful at project initiation to clarify scope and ownership before detailed mapping begins.
Value stream maps track production and logistics. They provide a timeline view of processes, highlighting delays and inventory build-up in manufacturing and services. A distribution centre mapping goods receipt to despatch would use a value stream map to find where stock sits idle.
BPMN diagrams are the formal standard for complex workflows. BPMN enables detailed analysis and improvement of process execution using defined symbols and notation. Software development teams and compliance-heavy industries favour BPMN because it leaves no room for interpretation.
Pro Tip: Choose your map type based on two factors: the complexity of the process and the technical literacy of your audience. A board-level review needs a flowchart. A process redesign team needs BPMN.
2. How process mapping examples apply across different industries
Process mapping is not a single-industry tool. Its application shifts depending on what each sector prioritises.
Manufacturing teams use value stream maps to track production lines from raw material intake to finished goods despatch. The goal is to find where inventory accumulates or where machine downtime creates bottlenecks. A car parts manufacturer mapping its assembly line will typically identify three to five delay points that were invisible in written procedures.
Healthcare organisations rely on swimlane diagrams and flowcharts to coordinate patient care. A patient admission process that crosses triage, nursing, pharmacy, and billing is a textbook swimlane example. The map clarifies which team is responsible at each stage, reducing the risk of steps being missed during shift changes.
Sales and customer service teams map pipelines and escalation paths. A sales pipeline flowchart shows the journey from lead qualification to contract signature, with decision points at each stage. An escalation process map shows when a customer query moves from a first-line agent to a specialist, and what information must travel with it.
Software development teams use BPMN and flowcharts to connect strategy to execution. A release management process, for example, maps code review, testing, sign-off, and deployment as a BPMN diagram. This makes compliance checkpoints explicit and auditable.
The common thread across all these industries is that effective process maps improve cross-team communication and accelerate delivery by making work visible and understandable. The format changes; the benefit does not.
3. Comparing process mapping templates: features and fit
Choosing the right template depends on the nature of your process and the size of your team. The table below compares the five main template types across the criteria that matter most to decision-makers.
| Template | Complexity level | Role clarity | Collaboration fit | Best use case |
|---|---|---|---|---|
| Flowchart | Low | Low | Small teams | Simple sequential processes |
| Swimlane diagram | Medium | High | Cross-functional teams | Multi-department handoffs |
| SIPOC diagram | Low | Medium | Project initiation teams | Scope definition and ownership |
| Value stream map | High | Medium | Operations and logistics teams | Manufacturing and supply chain |
| BPMN diagram | High | High | Technical and compliance teams | Complex, regulated workflows |
Flowcharts are the fastest to create and the easiest to read. Their weakness is that they do not show who is responsible for each step, which creates confusion in multi-team environments.
Swimlane diagrams solve the accountability problem but require more time to build accurately. They work best when you already know which roles or departments are involved. Trying to build a swimlane before you understand the process fully produces a map that looks tidy but misrepresents reality.
SIPOC diagrams are underused outside of Six Sigma projects. They are genuinely useful at the start of any improvement initiative because they force agreement on scope before anyone draws a single process step.
Value stream maps require the most data to build correctly. They need cycle times, wait times, and inventory counts to be meaningful. Without that data, they become decorative rather than diagnostic.
Pro Tip: Adapt any template by adding a "pain point" annotation layer. Ask each stakeholder to mark where they experience delays or confusion on the draft map. This turns a documentation exercise into a diagnostic one.
4. How to select and customise process mapping templates for your organisation
Selecting the right template starts with two questions: what is the scope of the process, and who needs to understand the map?
Start by mapping the current "AS-IS" state before designing any future "TO-BE" improvement. Business analysts stress that mapping should objectively document reality before redesigning. Skipping this step produces maps that reflect how people think the process works, not how it actually works. The gap between those two versions is usually where the real problems hide.
Involve cross-functional teams early. The person who executes a step every day knows details that a manager documenting the process from memory will miss. A procurement officer, for example, will know about informal approval workarounds that never appear in the official procedure.
Follow a structured approach when building your map:
- Define the process boundaries: where does it start and where does it end?
- List every step in the current process, including informal workarounds.
- Assign ownership to each step.
- Identify decision points and exception paths.
- Validate the draft with all stakeholders before finalising.
- Document the agreed "TO-BE" state only after the "AS-IS" map is signed off.
Practitioners advise that solving problems during documentation risks ignoring hidden non-standard steps critical to the workflow. Keep the mapping phase and the improvement phase separate.
Digital tools that support real-time collaboration make the review cycle faster. Collaborative digital platforms allow real-time updates and AI-driven identification of bottlenecks, which reduces the number of review rounds needed to reach an accurate map. Keystoneconsulting's Videra platform takes this further by embedding mapped workflows directly into governance and reporting structures, so maps remain live documents rather than static files.
Pro Tip: Balance standardisation with flexibility. A template that is too rigid will be abandoned by teams who cannot make it fit their reality. Build in a "notes" field for each step so teams can flag exceptions without breaking the map's structure.
For teams evaluating process mapping software, the right tool should support version control, stakeholder commenting, and export to common formats.
Key takeaways
The most effective approach to business process mapping is to document the current "AS-IS" state accurately before designing any improvement, using the diagram type that matches your process complexity and audience.
| Point | Details |
|---|---|
| Match format to complexity | Use flowcharts for simple processes and BPMN for complex, regulated workflows. |
| Map "AS-IS" before "TO-BE" | Document reality first; redesign only after the current state is validated by stakeholders. |
| Involve cross-functional teams | Frontline staff know informal steps that managers documenting from memory will miss. |
| Use digital tools for live maps | Platforms with real-time collaboration keep maps accurate and reduce review cycles. |
| Annotate for pain points | Ask stakeholders to mark delays on draft maps to turn documentation into diagnosis. |
Why I think most teams get process mapping backwards
Most teams I have worked with treat process mapping as a documentation task. They assign it to one person, that person draws what they think the process looks like, and the resulting map gets filed somewhere and forgotten. That is not process mapping. That is process mythology.
The single most valuable thing I have learned from working across healthcare, construction, and facilities management is that documenting existing workflows without bias is genuinely difficult. People instinctively describe the process as it should work, not as it does work. The gap between those two versions is where every audit failure, every delivery delay, and every compliance breach lives.
The second mistake is trying to fix things during the mapping session. The moment someone says "well, we should really be doing it this way," the map stops being a record and starts being a wish list. Keep those conversations for the "TO-BE" phase.
The third mistake is overcomplicating the map for the wrong audience. A BPMN diagram presented to a board will produce glazed expressions and no decisions. A flowchart presented to a technical team will produce frustration and a dozen unanswered questions. The map is a communication tool. Match it to the room.
Technology helps, but it does not solve the human problem. The best platform in the world cannot compensate for a team that has not agreed on what the process actually is. Get the people right first. Then use the tools.
— Peter
How Keystoneconsulting supports your process mapping work
Keystoneconsulting brings 20 years of experience in delivery governance across healthcare, construction, and facilities management. The Videra platform embeds mapped workflows directly into governance structures, producing audit-ready compliance records and AI-powered reporting that stays current as processes change. This means your process maps do not sit in a folder. They drive real decisions.
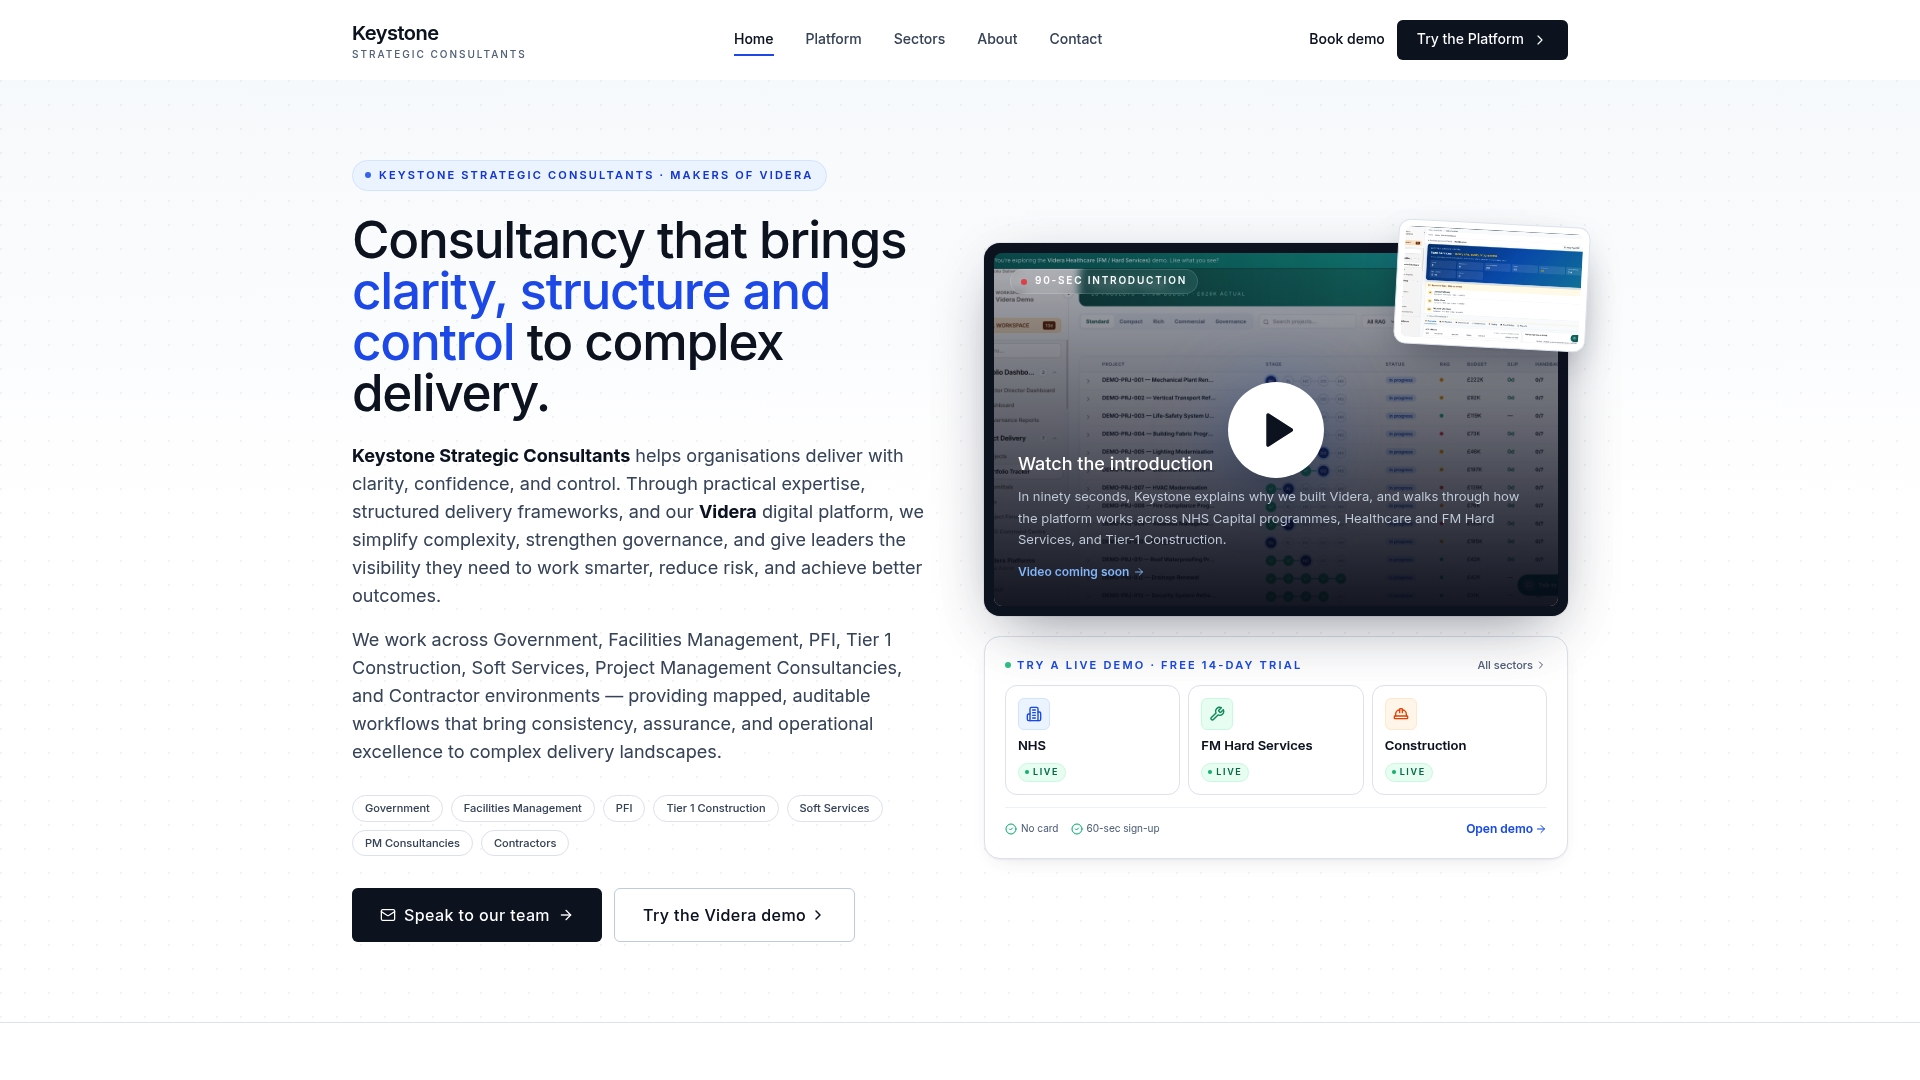
Teams that work with Keystoneconsulting do not receive a generic mapping exercise. Keystoneconsulting integrates directly with your team to document current workflows, identify governance gaps, and build the mapped "TO-BE" state that your organisation can actually deliver. If persistent reporting bottlenecks or compliance failures are slowing your operations, speak to Keystoneconsulting about how mapped workflows and the Videra platform can address them directly.
FAQ
What is business process mapping?
Business process mapping is the visual documentation of how work flows through an organisation, showing steps, decisions, roles, and handoffs. It is used to identify bottlenecks, clarify responsibilities, and standardise operations.
Which process map type should I use first?
Start with a flowchart if your process is simple and your audience is non-technical. Move to a swimlane diagram when multiple teams are involved, and use BPMN for complex or regulated workflows.
What is the difference between "AS-IS" and "TO-BE" process maps?
An "AS-IS" map documents the current state of a process exactly as it operates today. A "TO-BE" map shows the improved future state and should only be designed after the "AS-IS" map is fully validated.
How do I choose the right process mapping template?
Define the scope and audience of your process first. Simple sequential processes suit flowcharts; multi-department processes suit swimlane diagrams; complex regulated workflows suit BPMN. Match the format to the complexity and the technical level of the people who will use the map.
Can process maps support compliance and audit requirements?
Process maps that are kept current and linked to governance structures provide clear evidence of how work is controlled and who is accountable at each stage, which directly supports audit readiness.